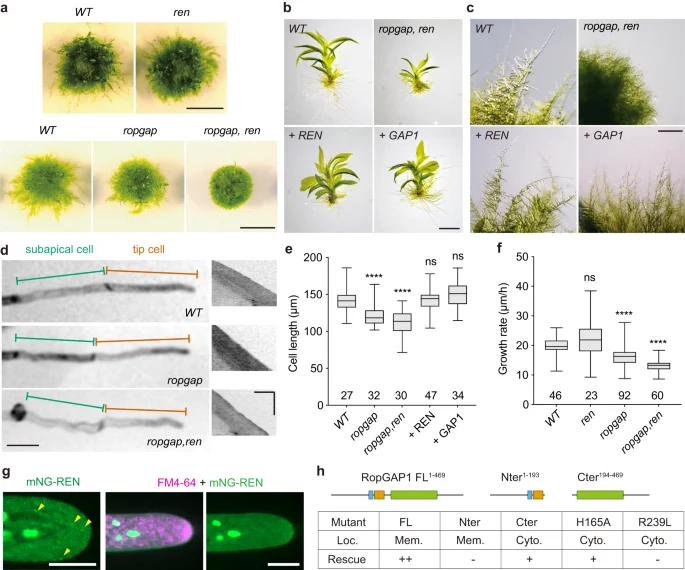
Physcomitrium patens wild-type and engineered moss colonies, gametophores and cells with growth measurements, Ruan and colleagues 2023 figure 4
The upper panels compare wild-type moss with gene-disrupted and rescued lines, showing colonies, gametophores and cell growth. The lower panels include microscopy, measurements and protein-localisation results. Green and magenta in the fluorescence panels represent experimental labels. The figure illustrates particular laboratory genotypes rather than the appearance of every wild plant.
Overview
Physcomitrium patens develops from spores into branching filaments called protonemata and later produces leafy gametophores. Its filamentous tissue includes chloronema cells and faster-growing caulonema cells, which contain fewer and smaller chloroplasts. These different forms make cell growth accessible to laboratory observation. A 2023 study by Jingtong Ruan and colleagues used derivatives of the Gransden ecotype to examine how a growing cell concentrates activity at one end. The culture is experimental material, rather than a nomenclatural type or a survey of the species across its range.
The study followed RHO OF PLANTs proteins, molecular switches that cycle between active and inactive states, together with proteins that regulate them. Fluorescent tagging showed PpROP4 and an activating protein concentrated around the growing dome. PpRopGAP1 occupied a broader membrane region, while PpREN was predominantly cytoplasmic. Time-lapse observations also found temporary membrane domains away from the growing tip: the switch and its activator appeared before PpRopGAP1. This ordering matters because the inhibitor did not have to arrive first to initiate every domain.
Genetic experiments distinguished overlapping functions from identical functions. Removing all six PpRopGAPs, or PpREN alone, caused only limited or undetectable growth changes under the reported conditions. Removing both sets produced stronger defects, including reduced fast-growing caulonema tissue, shorter cells and wavy filaments on nutrient-limiting medium. Expressing PpREN or PpRopGAP1 could rescue growth, but their increased expression had opposite effects on cell width: the former broadened cells and the latter narrowed them. Premature side-branch formation and changes in the membrane distribution of PpROP4 provided further evidence that the proteins regulate where growth begins as well as how it proceeds.
Biochemical assays helped explain why the two regulators were not interchangeable. PpRopGAP1 bound active PpROP4 more strongly, whereas PpREN stimulated its GTP hydrolysis at roughly a tenfold lower concentration in the assay. The authors proposed a balance between clustering of active switches and their rapid inactivation to coordinate polarized growth and cell width. That is a mechanistic model supported by perturbations, imaging and purified-protein tests; it is not a complete account of every regulator in a moss cell. Polarity and tip growth were not wholly abolished in the combined mutant, suggesting additional regulation. Whether these proteins directly control cell division also remained unresolved.
Origins & earliest records
Living moss; the focal 2023 experiments used laboratory lines derived from the Gransden ecotype.
Evidence & interpretation
Fluorescent localization, gene-editing and rescue experiments, and purified-protein assays connect cell morphology with proposed molecular regulation.
Selected bibliography
Documented works and useful reading. This is not a list of every appearance.
- 01
Two subtypes of GTPase-activating proteins coordinate tip growth and cell size regulation in Physcomitrium patens
Nature Communications 14:7084; main experimental report and culture, imaging, genetic and biochemical Methods. CC BY 4.0.
- 02
The Physcomitrella Genome Reveals Evolutionary Insights into the Conquest of Land by Plants
Science 319:64–69, 4 January 2008; online 13 December 2007; DOI 10.1126/science.1150646.
Family, evolution & connections
Hornwort placement in Li et al.’s 2020 genome analysis
Eight retained species from the 21-genome Figure 2 amino-acid topology. Bonn and Oxford Anthoceros agrestis strain tips are collapsed into one species label; the sampled vascular plants are reduced to Selaginella moellendorffii. Other tips are pruned.
Scroll sideways to see all branches. With a keyboard, focus the tree and use the arrow keys.
- Selected Figure 2 topology
- Klebsormidium nitens
- Remaining selected streptophytes
- Chara braunii
- Remaining selected samples
- Mesotaenium endlicherianum
- Land plants (bootstrap 100; SH-aLRT 100; local posterior 1.0)
- Selaginella moellendorffii
- Bryophytes (bootstrap 100; SH-aLRT 100; local posterior 1.0)
- Moss / liverwort lineage (bootstrap 100; SH-aLRT 100; local posterior 1.0)
- Sampled hornworts
- Anthoceros punctatus
742 mostly single-copy orthogroups; MAFFT alignments, IQ-TREE concatenation and ASTRAL gene-tree summary. Thick original branches indicate maximal support in both nucleotide and amino-acid analyses: 1,000-replicate ultrafast bootstrap and SH-aLRT, and local posterior probability. The inset supports the bryophyte hypothesis in over half of gene-tree quartets, leaving substantial discordance. Displayed support belongs to original nodes and is not recalculated after pruning. Thin branches receive no invented value. The 0.2 scale is substitutions per site, not time; no living species is shown as a direct ancestor. Historical source names are retained.
Selected plants in Park et al.’s 2021 duckweed nuclear-gene tree
Eight retained species from Figure 2a: one moss, one lycophyte, water lily, Arabidopsis and four monocots. Other sampled dicots and monocots are pruned.
Scroll sideways to see all branches. With a keyboard, focus the tree and use the arrow keys.
- Selected sampled plants
- Remaining sampled vascular plants
- Selaginella moellendorffii
- Selected sampled flowering plants
- Nymphaea colorata
- Remaining sampled flowering plants
- Selected sampled monocots
- Oryza sativa
- Selected sampled Alismatales
- Zostera marina
- Spirodela / Wolffia pair
- Spirodela polyrhiza
BEAST Bayesian inference using six highly conserved nuclear genes shared by Wolffia, Spirodela, rice and Zostera. ProtTest selected the LG model. The analysis fixes the moss-root calibration at 496 million years; dates are not reproduced here. This small-marker historical hypothesis is distinct from a genome-wide species-tree analysis. Figure colors represent posterior probability, but no exact probabilities are extracted from colors. Green/red numbers are gene-family gains/losses, not support; horizontal bars are divergence-time intervals. Calibration and broad model uncertainty do not date living species or identify direct ancestors.
Taxonomic classification
A hierarchy of classified groups, not a chain of direct ancestors.
- kingdomPlantae
- genusPhyscomitrium
- speciesPhyscomitrium patens
Located primary passages
Specific passages supporting details in this entry, grouped by their published witness.
The Physcomitrella Genome Reveals Evolutionary Insights into the Conquest of Land by Plants
2008 issue
- The Gransden 2004 draft supports comparisons of gene-family expansion, signalling and stress-response machinery across moss, algae and flowering plants. These comparisons reconstruct evolutionary changes; they do not make a living moss the direct ancestor of flowering plants. Gene-presence and functional interpretations remain distinct.
Complete main 64–68 and captions 1–4; references/credits/date 69 (PDF 2–7).
Supplementary methods/trees/data and experimental replication unreviewed. Draft gene counts and pathway interpretations are dated, not a current complete annotation; adjacent unrelated articles excluded.
References
Sources supporting this profile. Linked pages have their own scope and editorial standards.
- ResearchRuan and colleagues 2023, CC BY 4.0Research access: 2026-10-05
Image credits
Scientific plant experiment photographs and microscopy figurePhyscomitrium patens wild-type and engineered moss colonies, gametophores and cells with growth measurements, Ruan and colleagues 2023 figure 4
The upper panels compare wild-type moss with gene-disrupted and rescued lines, showing colonies, gametophores and cell growth. The lower panels include microscopy, measurements and protein-localisation results. Green and magenta in the fluorescence panels represent experimental labels. The figure illustrates particular laboratory genotypes rather than the appearance of every wild plant.