
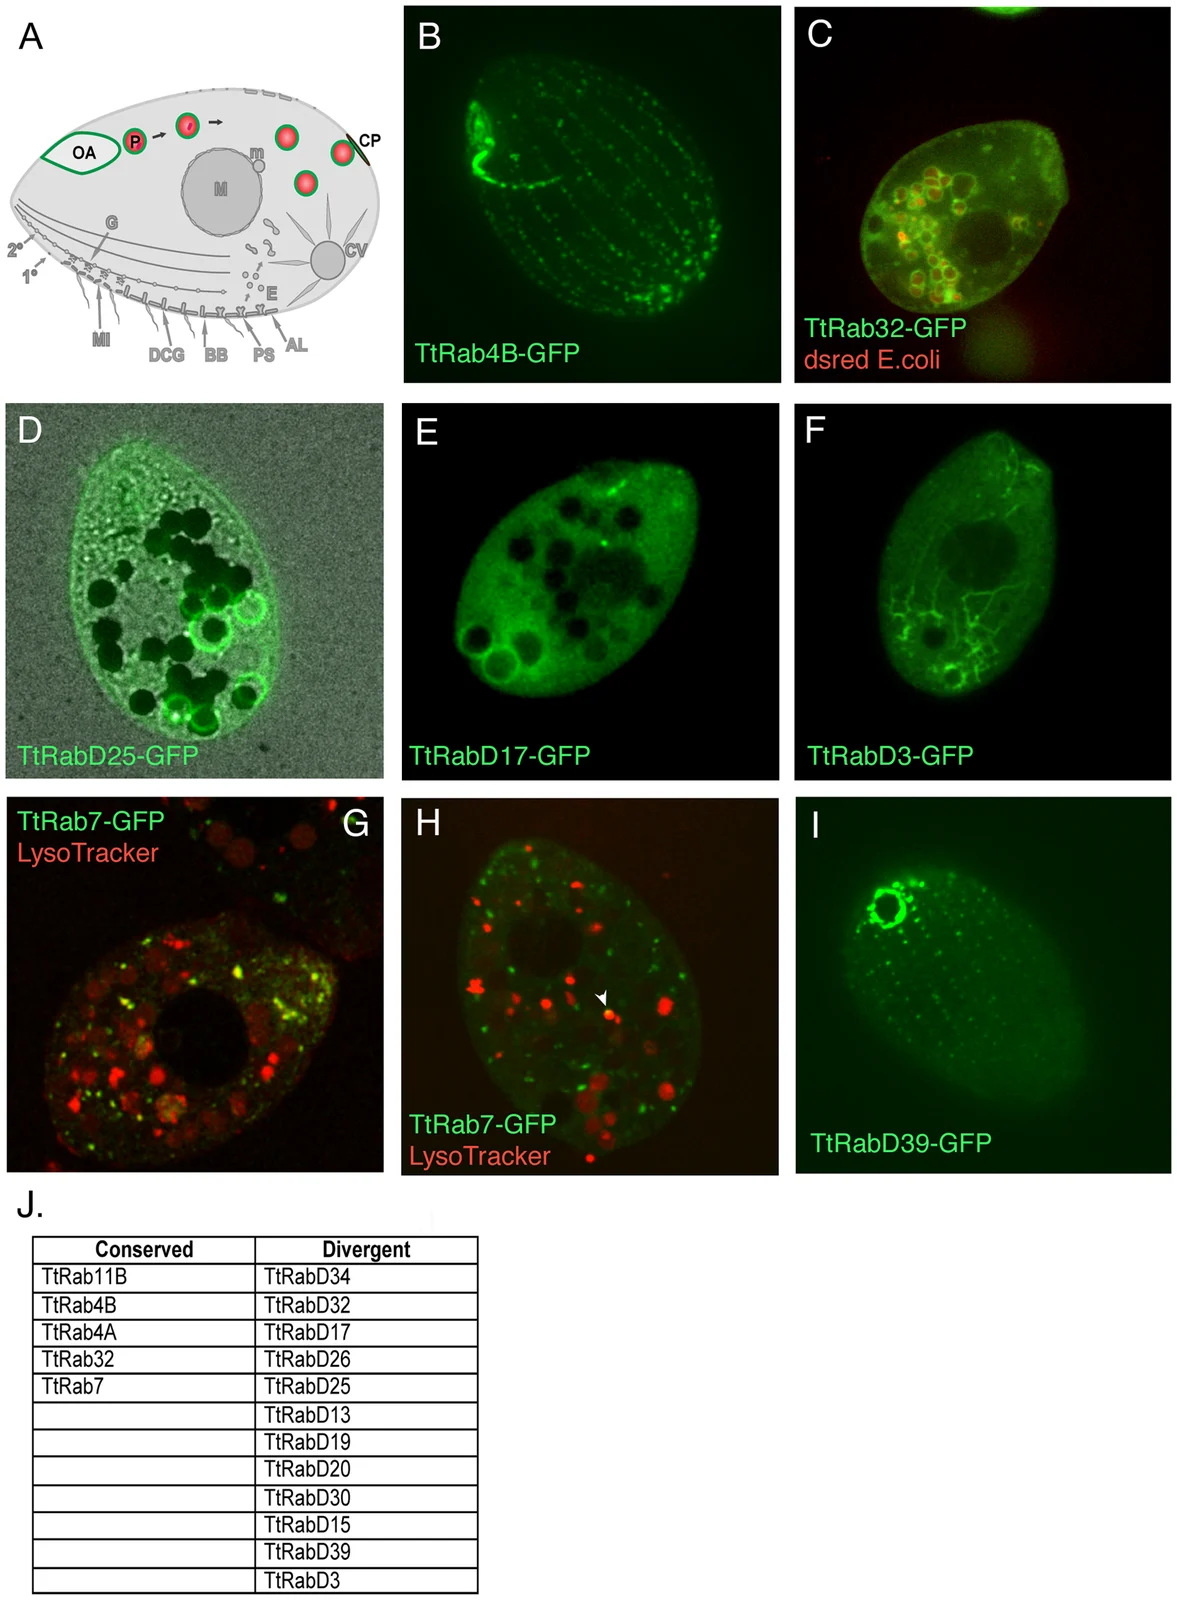
Green and red confocal images of cells accompany a phagocytosis diagram and Rab protein table.
Live Tetrahymena thermophila expressing GFP-tagged Rab proteins; whole Figure 2 includes a schematic and table. Colours are experimental fluorescence. These research transformants are not the catalogued CCAP 1630/4A sample.
Overview
CCAP 1630/4A is an axenic, non-type culture of mating type II. Its pre-1982 collecting history has no recorded country or habitat. The collection credits Nanney and McCoy, 1976.
The 2006 macronuclear genome study reported roughly 104 million bases, approximately 225 chromosomes and over 27,000 predicted protein-coding genes. These are the published assembly’s estimates.
Within one cell, the micronucleus preserves genetic material for sexual reproduction while the macronucleus directs gene expression. This germline–soma separation makes the species a model for molecular and cellular biology, without identifying it as an ancestral ciliate.
Origins & earliest records
The CCAP authority date is 1976; collection history is separate.
Evidence & interpretation
Deposited cultures and primary research.
Selected bibliography
Documented works and useful reading. This is not a list of every appearance.
- 01
Macronuclear Genome Sequence of the Ciliate Tetrahymena thermophila, a Model Eukaryote
Selected primary study.
Family, evolution & connections
Taxonomic classification
A hierarchy of classified groups, not a chain of direct ancestors.
Source note: CCAP supplies phylum, class and the binomial; intermediate ranks remain unspecified.
- phylumCiliophora
- classOligohymenophorea
- genusTetrahymena
- speciesTetrahymena thermophila
References
Sources supporting this profile. Linked pages have their own scope and editorial standards.
- Institutional culture catalogueCCAP cultureResearch access: 2026-10-07
- Primary researchMacronuclear genomeResearch access: 2026-10-07
Image credits
Whole experimental microscopy comparisonGreen and red confocal images of cells accompany a phagocytosis diagram and Rab protein table.
Live Tetrahymena thermophila expressing GFP-tagged Rab proteins; whole Figure 2 includes a schematic and table. Colours are experimental fluorescence. These research transformants are not the catalogued CCAP 1630/4A sample.