Deinococcus radiodurans Nile Red membrane imaging with cell-cycle diagrams and measurements, Floc’h and coauthors2019 figure1
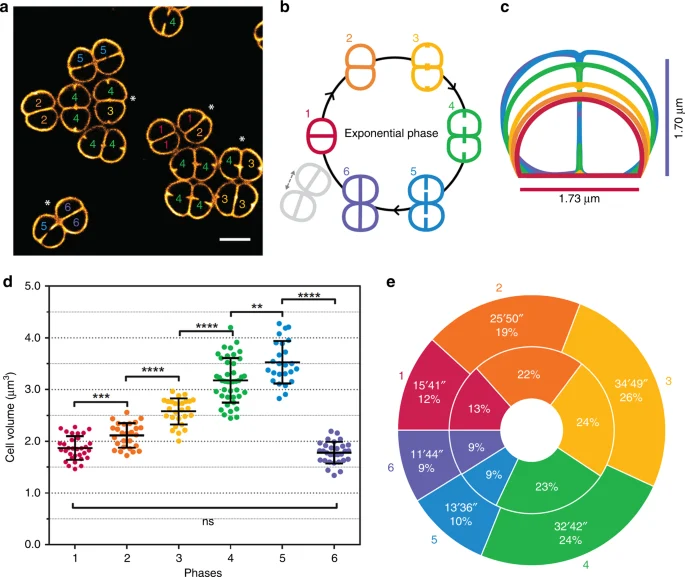
Panel a images live Deinococcus radiodurans cells with the membrane dye Nile Red. The other panels connect cell outlines, volume measurements and timing to stages of growth. The bright membrane signal and the numbered color scheme are imaging and analytical conventions, rather than an unstained view of the bacterium.
Overview
Deinococcus radiodurans is a relatively large, approximately spherical bacterium studied for its resistance to DNA-damaging conditions. Its genomic material comprises multiple copies of four replicons, including two chromosomes and two plasmids, rather than one isolated chromosome per cell. A 2019 microscopy study investigates how this complex DNA complement is organized as the bacteria grow and divide. The work provides a dynamic cellular account, instead of treating resistance as an unexplained property of a permanently fixed ring of DNA.
In the examined rich-medium cultures, growing cells commonly form pairs that briefly become groups of four. Successive divisions occur in perpendicular planes. The new separating wall grows inward from opposing sides, resembling closing doors rather than a circular diaphragm. Cells in a pair need not divide synchronously. Their walls grow both around the periphery and in the separating regions, as supported by fluorescent pulse-labeling measurements. The measured cell-cycle duration, about 134 minutes under the time-lapse conditions, belongs to this experimental setting rather than a universal generation time.
The nucleoid, the organized DNA-containing region, changes shape during that cycle. Live-cell images show rings, more open crescents, elongated forms and branched configurations. Late in division, linked double-ring arrangements can place one DNA region in each future daughter cell before complete separation. The researchers use both a DNA stain and a fluorescently labeled version of the DNA-associated HU protein to compare these appearances. Similar patterns with two labeling approaches support the observations, while altered volumes in the HU-tagged strain indicate that a fluorescent tag can itself affect the system.
Measured nucleoids occupy roughly one-third of growing cell volume, with the fraction changing through the cycle and falling further in stationary cultures. A comparison with Escherichia coli shows why an apparently compact image is not a sufficient measurement: cell size and the number of genome copies also matter. Tracking and fluorescence-recovery experiments suggest that HU associates transiently with DNA. This mobility offers a possible explanation for rapid structural changes, rather than proving that HU alone directs every rearrangement.
Fluorescent markers near the replication origin and termination region of chromosome 1 reveal different distributions. Origin-associated signals occur radially around more centrally clustered termination-associated signals, whose segregation happens late in division. The clustering mechanism remains unknown. Counts include only clearly distinguishable bright signals, so they do not directly count every chromosome copy. The study links chromosome organization with cell geometry and division, but does not establish that a particular nucleoid shape causes radiation resistance. Efficient DNA repair, antioxidant protection and multicopy genomic organization remain separate contributing hypotheses discussed in its background.
Origins & earliest records
Floc’h and colleagues’ 2019 study follows wild-type cultures and engineered HU- or chromosome-locus-labeled research strains. These experimental strains are not newly designated nomenclatural types.
Evidence & interpretation
Time-lapse and super-resolution microscopy, cell-wall labeling, nucleoid volume measurements and protein tracking document cell-cycle organization. Fluorescent tag effects, unresolved clustering mechanisms and limited locus detection remain explicit.
Selected bibliography
Documented works and useful reading. This is not a list of every appearance.
- 01
Cell morphology and nucleoid dynamics in dividing Deinococcus radiodurans
Nature Communications 10,3815; complete main Results, Discussion and Methods, including fluorescent labeling, tracking and image analysis. Original adaptation of CC BY 4.0 article, https://creativecommons.org/licenses/by/4.0/.
- 02
Improved Complete Genome Sequence of the Extremely Radioresistant Bacterium Deinococcus radiodurans R1 Obtained Using PacBio Single-Molecule Sequencing
Genome Announcements4(5):e00886-16,1September2016; Europe PMC deposited article XML.
Family, evolution & connections
Taxonomic classification
A hierarchy of classified groups, not a chain of direct ancestors.
- DomainBacteria
- GenusDeinococcus
- SpeciesDeinococcus radiodurans
Genome-1999, genome-2016 and genome-2021 references
Zahradka et al. compare laboratory descendants of the same 1956 isolate. Their publication-year labels identify genome references, not species ages. Structural differences occur despite close relatedness; possible assembly errors and untested functional effects limit interpretation.
Located primary passages
Specific passages supporting details in this entry, grouped by their published witness.
Primary source witness
Genome Announcements4(5):e00886-16,1September2016; Europe PMC deposited article XML.
- Long-read resequencing of R1 produced an annotated3,344,765-nucleotide genome with two circular chromosomes and two circular plasmids. Comparison with the1999 reference detected insertions, deletions and substitutions, including previously reported ssb frameshifts. The resulting sequence is a resource for investigating radioresistance; this announcement does not itself establish a complete molecular explanation or experimentally validate every predicted gene.
Complete Genome Announcement, including sequencing, assembly, comparison and accession paragraphs.
GenBank datasets and cited experiments not reanalysed.1999 manuscript and2016 PMC webpage challenges held; no full1999 reading claim.
References
Sources supporting this profile. Linked pages have their own scope and editorial standards.
- ResearchFloc’h et al. 2019 primary live-cell studyResearch access: 2026-10-05
Image credits
Scientific organism microscopy and cell-cycle figureDeinococcus radiodurans Nile Red membrane imaging with cell-cycle diagrams and measurements, Floc’h and coauthors2019 figure1
Panel a images live Deinococcus radiodurans cells with the membrane dye Nile Red. The other panels connect cell outlines, volume measurements and timing to stages of growth. The bright membrane signal and the numbered color scheme are imaging and analytical conventions, rather than an unstained view of the bacterium.